UX Research
Quantum New Energy
EnerWisely Dashboard
Secondary Research - Heuristic Evaluation - Contextual Inquiry - Personas - Wireframes - Prototyping - Usability Testing
Quantum New Energy is building smart tools to empower their users to monetize their carbon reduction. Through technology and education, they encourage users at the residential and businesses levels to reduce their carbon footprint and save money by harnessing their behavioral data.
Project Overview
Tools Used
Figma, Zoom, Notion, Slack
Project Lead, UX Research and Analysis, Product Strategy, Personas, User Flows, Wireframes, Usability Testing
My Role
Quantum New Energy is a Houston based company founded by energy industry veterans. With their wealth of experience working for some of the largest energy companies, they are building smart tools to empower their users to monetize their carbon reduction.
Through technology and education, Quantum New Energy is encouraging users at the residential and business levels to reduce their carbon footprint.
Quantum New Energy has successfully launched a mobile application, EnerWisely, to work with consumers in the deregulated energy markets of Texas. EnerWisely is powered off of customer behavioral data partnered with the latest smart meter technology and functions as a smart marketplace to suggest the best companies and plans for users from a list of their sponsored companies. The application also recommends various solutions for reducing the user’s carbon footprint- this provides the customer with valuable tips on cost savings and aligns with the mission of Quantum New Energy in encouraging carbon reduction and democratizing carbon accounting in an easy and relatable way.
With the success of EnerWisely within consumer markets, Quantum New Energy is hoping to bring these same benefits to companies - they aim to help businesses streamline their carbon accounting, offer sustainability perks to employees and customers, and automate the carbon credit process from generation to market. They believe the best way to achieve these goals is through a SaaS dashboard interface that will be white labeled to energy companies who serve businesses of various sizes.
Our team was tasked with evaluating the effectiveness of current dashboard and making recommendations for improvements.
Problem Space
The project had several constraints that determined our chosen methods for research: We were given three weeks to complete the project, and due to the project being in a piloting phase, access to the current dashboard was limited and sometimes unstable. The most challenging of our constraints was that the team was tasked with sourcing our own client lists for contextual inquiry in order to maintain the firm project timeline. This challenge presented us with a unique opportunity to be inventive and not get wrapped up in only interviewing direct users but to instead ask ourselves: Who else sets goals? Manages tasks and progress?
Constraints
In order to determine what kind of research was needed for the success of the project, we began with a few questions for our stakeholders around how they would define success and
what their desired outcome would be. After aligning with the stakeholders, we generated a statement of work with a project timeline that laid out what questions we would explore and what deliverables we would deliver from our generated research.
Knowing that the amount of research would be lengthy and require organization in order to keep teammates and stakeholders up to date, I created a dashboard in Notion to act as a central place to organize all of our research, documentation, and templates for user interviews and usability test scripts. I also included templates for taking meeting notes and designated a rotation for note taking to ensure that we were documenting any expectations or important priorities that were expressed in meetings. As a researcher, I have found that this level of organization and systems provide me with a great sense of clarity and allow me to spend my mental energy on the research at hand.
Communication
With our goals in mind, we began our secondary research in order to gain a deeper understanding of the following of carbon accounting and the deregulated energy markets of Texas.
We created a detailed glossary of terms within our central documentation for reference to ensure that our team had aligned definitions of these terms and how they related to the project. As a bonus, because our stakeholders had identified a goal of creating relatable educational opportunities within their product to encourage awareness around business environmental impacts, so we interviewed several Environmental Scientists on their perspectives and what metrics they felt were most important to educate business owners on as well.
Secondary Research
Methods & Process
Why: A Heuristic Evaluation is a useful way to identify design problems within an existing user interface and are useful for stretching a limited research budget, as they can help identify areas of concern without having to test with participants. The current design is judged against a set of guidelines called Heuristics that make systems easy to use - these guidelines are based on human behavior, psychology, and information processing.
To initially evaluate how the current dashboard interface was performing, we ran a three individual heuristic evaluations on the most recent iteration available to the team. After our individual evaluations were complete, the team came together to compare notes and consolidate our ideas into a single document. During our evaluation we were able to uncover a number of concerns and document our recommendations in a deliverable that was given to the stakeholders for consideration. The violations were sorted by a rating scale of 1-5 for the level of urgency to address. This helped the development team prioritize issues and address accordingly.
Heuristic Evaluation
Why: Generative research is a method of interviewing that tells us why people are doing things and what they are thinking at a given moment. It helps us to stop thinking of who users are strictly in relation to the product and learn who they are as every day people. Though it can be more time consuming than something like a usability test, we can better understand what our users experience in their day to day lives and what they value.
We knew that the dashboard needed to serve several unique user groups with different business sizes, so we modeled our interviewee selection accordingly. 12 users were interviewed in remote 30-45 minute sessions. We created a set of baseline interview questions that all participants would be asked, and a secondary set of questions specific to various user groups that focused on their more in depth context. We chose to interview business owners, property managers and project managers.
Exploratory Research
Our goal from these contextual interviews were to learn the following:
How did they prefer to set goals?
How did they manage and track progress towards their goals?
Goals and goal setting:
Level of awareness around their personal energy usage
Did sustainability practices matter to them?
Sustainability and Environmental Impacts:
What were their day to day activities as a business owner?
What types of products they were using to help manage their businesses?
How they tracked and managed business goals
How they set goals and motivate behavior change for their employees
How they celebrate milestones with their teams
What were some of the strategies they use inspire their employees when they struggle to meet a goal?
What priority does environmental impact have within their business practices?
What sustainability practices did they have in place already?
Business Owners:
Inspiring behavior change with social causes:
What inspires them to learn something new?
When learning something new, do they have a preferred learning “style”?
What are social causes that matter to them - and what is it about that cause that matters to you
What motivates their behavior change for them?
Why: Evaluative research is useful for validating concepts, testing prototypes, and knowing whether or not an existing design is headed in the right direction. It can and should be done throughout the stages of the development lifecycle. Usability tests are a beneficial evaluative method to ground products in the needs and goals of real users by investigating if it meets expectations, is easy to access and use, and is enjoyable.
Usability tests were run at two different points during our project timeline to uncover user expectations and identify necessary changes.
The first round of remote tests were conducted via zoom and were unmoderated with a set of prompts for users to accomplish. During this round of tests, our team observed how the user attempted to resolve tasks and waited for the task to complete before asking any questions about their experience. The unmoderated test was beneficial in that participants could carry out tasks in their own environment at their own pace. It also provided valuable feedback on what aspects of the dashboard design were usable and made sense to the participants, and what flows did not.
Our second round of usability tests were conducted in both remote and in-person environments and moderated with a set of prompts for users to accomplish. This round of tests was performed on a prototype of the dashboard with our initial design recommendations. These tests helped us to verify that our changes had positively addressed concerns. Participants walked through our newly developed onboarding flow, adding a new location to their profile, and setting goals.
Usability Tests

Analysis
Content analysis was conducted on the qualitative data from our exploratory research. Through affinity mapping, various themes emerged around goal setting, learning preferences, and how users develop empathy for environmental and social issues.
Key Findings
When approaching a large goal, users want a sense of organization in order to stay motivated.
Users want to break things up into smaller phases, set timelines, and establish a way of knowing that they’ve achieved the goal.
Users feel a sense of accomplishment when they get to mark something as complete.
Goal Setting:
Users feel empowered and confident when learning new things, and learn best through visual and interactive elements
Users want the opportunity to engage with materials and test things out on their own over just being told what to do.
Learning:
Users care generally about social causes, but need to feel connected to a cause in order to take any action and can sometimes feel discouraged about their ability to make change
Users learn best about social causes when presented with simple terminology and visualizations on how they will personally be impacted.
Users feel generally discouraged and negative about the greater public and it’s ability to affect change within climate change.
Environmental and Social Issues:
Enjoy the freedom and flexibility of running their own business, but struggle with the pressures of being solely in charge of financials and smaller details of business ownership.
Care about reducing the carbon footprint of their business for personal and financial reasons.
Business owners:
While in a project, users establish a routine in order to monitor goals - they need to understand progress on multiple levels and they need to interact with multiple sources and formats to get that information.
Users value customization and the ability to build or expand functionality when needed within their preferred UI experiences.
Preferences within an application:
From these insights, we developed a primary and secondary persona to encapsulate our surveyed participants and represent their respective goals, needs and frustrations. Personas summarize the key attributes of different user groups and help teams to avoid designing for an “elastic” user- they keep teams aligned around specific data from their users.
Personas
Primary persona
a small business owner running a string of coffee shops in Houston, Texas

Secondary persona
a facilities manager working for large corporation in Austin
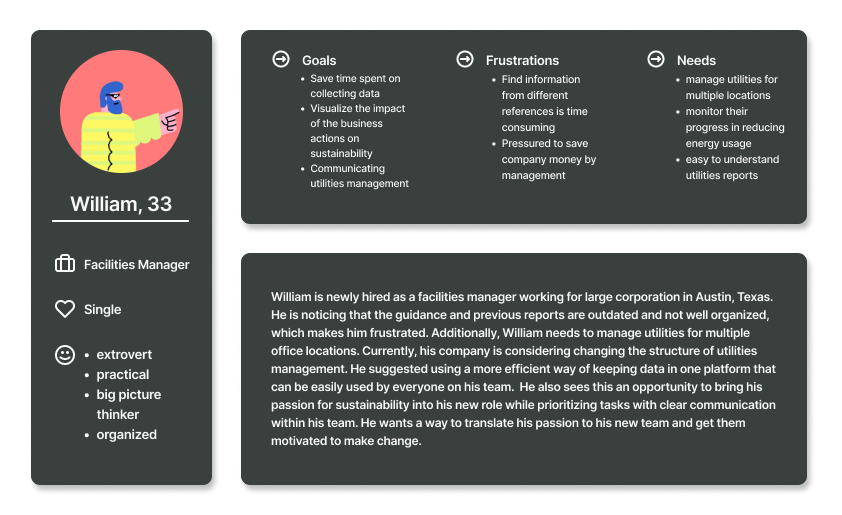
Though our personas differ in education, professional levels of responsibility and business size, both Camila and William are visual learners, are motivated by saving money for their businesses, and need to manage multiple locations.
Round one
Through our first round of usability tests on the existing design, we learned a number of things:
Participants did not understand why they were being asked for larger amounts of behavioral data.
Half of participants did not have the required information necessary to complete initial questionnaire.
Participants expressed boredom and a lack of understanding as to the length of time for the loading screen.
Once they had arrived on the dashboard interface, users felt overwhelmed with the amount of data immediately presented to them and struggled to interpret data.
Participants did not understand the functionality of the “Progress vs Goals”, energy consumption variation, or carbon emissions variation visualizations.
Usability Test Findings
After conducting exploratory research, developing key findings and personas, running heuristic evaluations and our first round of usability tests on the existing dashboard, our team developed an initial prototype to explore suggested changes. A second round of usability tests were conducted using this prototype.
Round two
These tests helped us to verify that our changes had positively addressed concerns. A test plan was created to have users accomplish a set of tasks while they moved through the onboarding flow, adding a new location, and setting/adjusting goals.
We found:
Users had a greater understanding of why their data was being collected and the purpose it served in forming data visualizations
Users found tooltip content useful, but commented that the text size was too small
Were interested in the goal setting page, but encountered errors when attempting to set a new goal
Actionable Recommendations
From the research findings and multiple rounds of usability tests, we provided stakeholders with actionable recommendations to pursue for the Quantum New Energy dashboard UI.
An onboarding flow that communicates company values and explains why various information is needed to set user expectations and instill confidence in the reliability of the product.
Utilize the loading screen by including simple animations and educational information about the process taking place to engage users and discourage drop off.
A consistent design pattern for various data visualizations on the dashboard to eliminate user fatigue in interpreting data.
Visually communicating custom financial and environmental impacts of their current progress for motivation.
Impact
I am proud of this research project with Quantum New Energy because of the impact that it made for the team and for future iterations of the dashboard. The exploratory research conducted has established a baseline for future research to be conducted in the future. As Quantum New Energy continues to develop a deeper user base, comparisons between our research can be done to see if any significant changes in the user journey have occurred. Once the dashboard is released, more behavioral data can be accrued and utilized to further validate the information that we gathered during this project.